Analysis of Mannose
Click here to place an order for determining Mannose.
Request a QuoteMannose Content
Analysis Packages for Mannose
Total Sugars, Glucose, Xylose, Mannose, Arabinose, Galactose, Rhamnose, Lignin (Klason), Lignin (Acid Soluble), Acid Insoluble Residue, Extractives (Ethanol-Soluble), Extractives (Water-Soluble), Extractives (Exhaustive - Water then Ethanol), Extractives (Water-Insoluble, Ethanol Soluble) , Ash, Ash (Acid Insoluble)
Total Sugars, Glucose, Xylose, Mannose, Arabinose, Galactose, Rhamnose, Lignin (Klason), Lignin (Klason - Protein Corrected), Lignin (Acid Soluble), Acid Insoluble Residue, Extractives (Ethanol-Soluble), Extractives (Water-Soluble), Extractives (Exhaustive - Water then Ethanol), Extractives (Water-Insoluble, Ethanol Soluble) , Ash, Ash (Acid Insoluble), Glucuronic Acid, Galacturonic Acid, 4-O-Methyl-D-Glucuronic Acid, Protein Content of Acid Insoluble Residue, Carbon Content of Acid Insoluble Residue, Hydrogen Content of Acid Insoluble Residue, Nitrogen Content of Acid Insoluble Residue, Sulphur Content of Acid Insoluble Residue, Xylitol, Sucrose, Fructose, Sorbitol, Trehalose
Total Sugars, Glucose, Xylose, Mannose, Arabinose, Galactose, Rhamnose, Lignin (Klason), Lignin (Acid Soluble), Carbon, Extractives (Ethanol-Soluble), Extractives (Water-Soluble), Extractives (Exhaustive - Water then Ethanol), Extractives (Water-Insoluble, Ethanol Soluble) , Ash, Ash (Acid Insoluble), Starch, Pectin, Glucuronic Acid, Galacturonic Acid, 4-O-Methyl-D-Glucuronic Acid
Analytical Procedure for Mannose
☑ Step 1: Acid Hydrolysis of the Sample
In the case where three different types of extracted material exist (water-extracted, ethanol-extracted, and water- then ethanol-extracted) then the sample that has undergone both water and ethanol extraction is typically used for acid hydrolysis, unless otherwise requested by the customer.
The following steps are involved in the acid hydrolysis of a sample.
1. The moisture content of the sample is determined, in duplicate.
2. Approximately 300 mg (with the exact weight noted) of the sample is added to a pressure tube.
3. 3.00 mL of 72% H2SO4 is added by means of an automatic titrator, the weight of the acid added is noted.
4. The sample is mixed thoroughly with the acid using a glass rod, care is taken that no sample stays adherent to the sides of the tube, but instead stays in contact with the acid.
5. The tube is transferred to a water bath that is maintained at 30 degrees celcius.
6. Steps 2-5 are repeated for the duplicate sample.
7. Every 10 minutes the glass rod for each pressure tube is stirred so that the acid reaches all parts of the sample and complete hydrolysis occurs. This is a crucial step.
8. Exactly one hour after it is placed in the water bath the pressure tube is removed and placed on a scales and 84 mL of water added (with the weight of the added water recorded). Any acid/sample on the rod is removed from the rod at this point using this water.
9. A lid is screwed on the tube and the tube is inverted several times to ensure thorough mixing of the acid.
10. Two sugar recovery solution (SRS) pressure tubes are prepared in order to monitor the sugar-loss associated with the second-stage-hydrolysis. This involves the following steps:
(a) 348 microlitres of 72% H2SO4 is added to a test tube containing a solution containing a known weight (approximately 10 g) of a sugar standard. This standard should be of a similar sugar composition to that expected of the samples being analysed. The acid and sugar solution are thoroughly mixed.
(b) The sugar-acid mixture is transferred to a pressure tube which is then sealed.
11. All SRS and sample pressure tubes are placed in an autoclave which is run at 121 degrees celcius for 60 minutes.
12. After the temperature in the autoclave drops to under 80C the tubes are removed and are left (closed) in the lab until they reach room temperature.
13. The hydrolysates are then filtered (using vacuum suction) through filter crucibles of known weight and the resulting filtrate is stored.
14. Any residual solids are washed out from the tube using deionised water until all the Acid Insoluble Residue resides on the filter crucible.
☑ Step 2: Hydrolysate Dilution and Storage
☑ Step 3: Chromatographic Analysis of the Hydrolysate
Equipment Used for Mannose Analysis
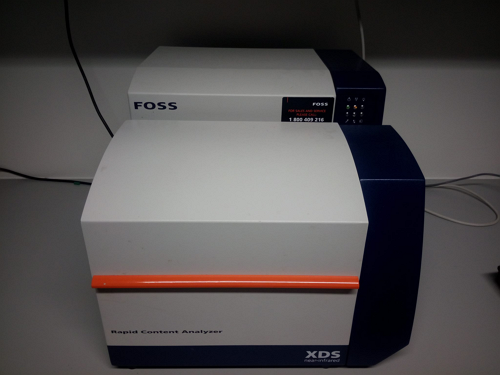
NIR Spectrophotometers
We have several FOSS XDS NIR devices. These have solid content modules, that can allow for samples of a heterogenous particle to be analysed, and liquid modules that allow liquids to be analysed via transmittance spectroscopy.
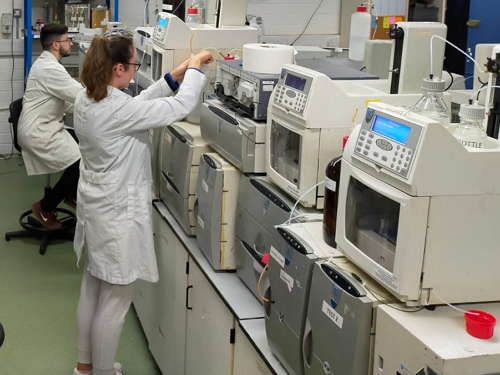
Ion Chromatography
A Dionex ICS-3000 system that is equipmed with electrochemical, conductivity, and ultraviolet-visible detectors.
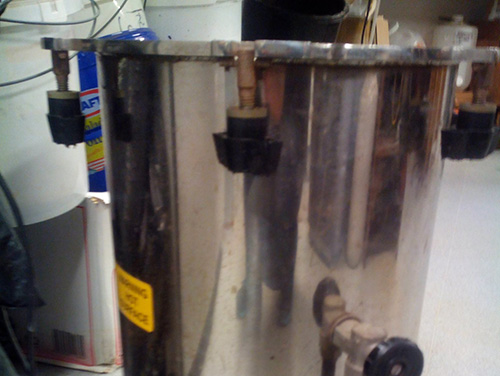
Autoclave
An autoclave is used in the protocols for the determination of the lignin and structural sugars (cellulosic and hemicellulosic) contents of samples.
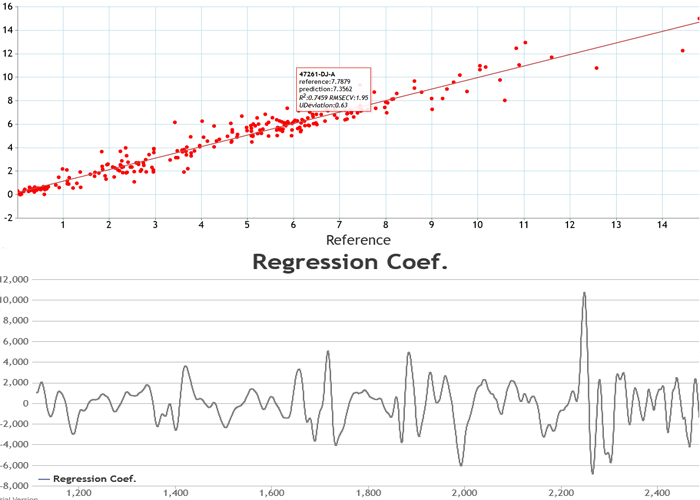
NIR Model
| Mannose Global 1 | |
| Min. Value (%) | 0.00 |
|---|---|
| Max. Value (%) | 14.04 |
| Calibration Samples | 451 |
| Validation Samples | 154 |
| R2 (Validation) | 0.9560 |
| RMSEP (%) | 0.6053 |
| Bias (%) | 0.0013 |
| SEP (%) | 0.6073 |
| RPD | 4.7650 |
| RER | 23.1195 |
Analytical data and quantitative near infrared (NIR) spectroscopy models for various lignocellulosic components (including Klason lignin and the constituent sugars glucose, xylose, mannose, arabinose, galactose, and rhamnose), ash, and ethanol-soluble extractives, were obtained for 53 samples of paper and cardboard. These samples were mostly the type of materials typically found in domestic wastes (e.g. newspapers, printing paper, glossy papers, food packaging). A number of the samples (48) were obtained by separating a sample, after milling, into two particle size fractions. It was found that the fractions containing the smaller particles typically had higher ash and Klason lignin contents and lower glucose and xylose contents that the larger particle size fractions. Nevertheless, all of the sample types had attractive total sugars contents (>50%) indicating that these could be suitable feedstocks for the production of biofuels and chemicals in hydrolysis-based biorefining technologies. NIR models of a high predictive accuracy (R2 of > 0.9 for the independent validation set) were obtained for total sugars, glucose, xylose, Klason lignin, and ash and with values for the Root Mean Square Error of Prediction (RMSEP) of 2.36%, 2.64%, 0.56%, 1.98%, and 4.87%, respectively. Good NIR models (R2 of > 0.8) were also obtained for mannose, arabinose, and galactose. These results suggest that NIR is a suitable method for the rapid, low-cost, analysis of the major lignocellulosic components of waste paper/cardboard samples. | |
Analytical data and quantitative near infrared (NIR) spectroscopy models for various lignocellulosic components (including Klason lignin and the constituent sugars glucose, xylose, mannose, arabinose, galactose, and rhamnose), moisture, and ash were obtained for 53 peat samples. These included samples with high, medium, and low degrees of humification. Klason lignin was the main constituent and was greatest in the samples classified as being highly humified, with structural sugars the lowest in this class. The total sugars contents of all samples were considered to be insufficient to allow for their use in biorefining hydrolysis processes for the production of chemicals and biofuels. NIR models were developed for spectral datasets obtained from the samples in their unprocessed (wet), dry and unground, and dry and ground states. Typically the most accurate models were based on the spectra of dry and ground samples. However the NIR models for the wet samples still offered reasonable predictive capabilities. All models were suitable at least for sample screening, with the models for total sugars, glucose, xylose, galactose, and moisture suitable for quantitative analyses. | |
Miscanthus plants were sampled from several plantations in Ireland over the harvest window (October-April). These were separated into their anatomical components and the loss of leaves monitored. Three distinct phases were apparent: there was minimal loss in the "Early" (October to early December) and "Late" (March and April) phases, and rapid leaf loss in the interim period. Samples were analysed for constituents relevant to biorefining. Changes in whole-plant composition included increases in glucose and Klason lignin contents and decreases in ash and arabinose contents. These changes arose mostly from the loss of leaves, but there were some changes over time within the harvestable plant components. Although leaves yield less biofuel than stems, the added biomass provided by an early harvest (31.9-38.4%) meant that per hectare biofuel yields were significantly greater (up to 29.3%) than in a late harvest. These yields greatly exceed those from first generation feedstocks. | |
The aim of this work was to study the production of exopolysaccharide (EPS) from a novel ustilaginomycetes yeast strain Pseudozyma sp. NII 08165. The culture produced 3.5g/l EPS on fourth day of fermentation in a glucose-based medium. The structural characterization revealed that the EPS was a polymer of glucose, galactose and mannose in the ratio of 2.4:5.0:2.6 with a molecular weight of 1.7MDa. The pseudoplastic behaviour of aqueous EPS with a thermal stability up to 220 C indicated its potential utility as a thickening or gelling agent in food industry. SEM studies of the EPS showed that it had compact film-like structure, which could make it a useful in preparing plasticized films. The AFM studies showed that EPS had spike-shaped microstructure. Physical properties of the exopolysaccharide determined further indicated its possible potential in different industrial applications. | |
Miscanthus samples were scanned over the visible and near infrared wavelengths at several stages of processing (wet-chopped, air-dried, dried and ground, and dried and sieved). Models were developed to predict lignocellulosic and elemental constituents based on these spectra. The dry and sieved scans gave the most accurate models; however the wet-chopped models for glucose, xylose, and Klason lignin provided excellent accuracies with root mean square error of predictions of 1.27%, 0.54%, and 0.93%, respectively. These models can be suitable for most applications. The wet models for arabinose, Klason lignin, acid soluble lignin, ash, extractives, rhamnose, acid insoluble residue, and nitrogen tended to have lower R(2) values (0.80+) for the validation sets and the wet models for galactose, mannose, and acid insoluble ash were less accurate, only having value for rough sample screening. This research shows the potential for online analysis at biorefineries for the major lignocellulosic constituents of interest. | |
The processing of lignocellulosic materials in modern biorefineries will allow for the
production of transport fuels and platform chemicals that could replace petroleum-derived
products. However, there is a critical lack of relevant detailed compositional information
regarding feedstocks relevant to Ireland and Irish conditions. This research has involved the
collection, preparation, and the analysis, with a high level of precision and accuracy, of a
large number of biomass samples from the waste and agricultural sectors. Not all of the
waste materials analysed are considered suitable for biorefining; for example the total sugar
contents of spent mushroom composts are too low. However, the waste paper/cardboard
that is currently exported from Ireland has a chemical composition that could result in high
biorefinery yields and so could make a significant contribution to Ireland�s biofuel demands. | ||
Additional Material
See our pitches for the 2024 topics.
Click here to view our pitches for involvement in proposals for the 2024 research topics of the Circular Bioeconomy Europe Joint Undertaking (CBE-JU).
Lignin (Klason), Lignin (Acid Soluble), Acid Insoluble Residue, Ash (Acid Insoluble),
As P10 plus protein-corrected lignin, water-soluble sugars, uronic acids, acetyl content and starch.
Glucuronic Acid, Galacturonic Acid, Mannuronic Acid, Guluronic Acid, 4-O-Methyl-D-Glucuronic Acid, Iduronic Acid,
Total Sugars in Enzyme Hydrolysate, Glucose in Enzyme Hydrolysate, Xylose in Enzyme Hydrolysate, Arabinose in Enzyme Hydrolysate, Mannose in Enzyme Hydrolysate, Galactose in Enzyme Hydrolysate, Rhamnose in Enzyme Hydrolysate, Cellobiose in Enzyme Hydrolysate, Enzymatic Hydrolysis Kinetics, Cellulose Conversion Yield, Xylan Conversion Yield, Combined Sugar Yield, Cellulose Conversion Rate, Xylan Conversion Rate,
As P121 plus comparisons with data from the non-pretreated original sample, including: Increase in Cellulose Accessibility after Pre-Treatment, Percent Increase in Cellulose Conversion Efficiency, Percent Increase in Cellulose Conversion Rate.
As P9 but on the solid residue after enzymatic hydrolysis.
Formic Acid, Acetic Acid, Levulinic Acid, Furfural, Hydroxymethylfurfural,
Includes all hydrolysate sugars and kinetics in P121 and: Cellulose Conversion Yield, Cellulose Conversion Rate
Includes all hydrolysate sugars and kinetics in P121 and: Xylan Conversion Yield, Xylan Conversion Rate
Total Sugars in Enzyme Hydrolysate, Glucose in Enzyme Hydrolysate, Maltose in Enzyme Hydrolysate, a-Amylase Hydrolysis Kinetics, Glucoamylase Hydrolysis Kinetics,
Glucose, Xylose, Fructose, Sucrose, Mannose, Arabinose, Galactose, Rhamnose, Xylitol, Sorbitol, Trehalose, Mannitol, Arabinitol, Glycerol, Raffinose,
Levulinic Acid, Formic Acid, Hydroxymethylfurfural, Furfural, Acetic Acid, gamma-Valerolactone,
Xylobiose, Xylotriose, Arabinobiose, Arabinotriose,
Maltose, Maltotriose, Maltotetraose, Maltopentaose, Maltohexaose, Maltoheptaose, Maltooctaose,
Glucuronic Acid, Galacturonic Acid, Mannuronic Acid, Guluronic Acid, 4-O-Methyl-D-Glucuronic Acid, Iduronic Acid,
Gibberellic Acid, Indole-3-acetic acid, Indole-2-acetic acid, Indole-3-propionic acid, Indole-3-butyric acid, 6-Benzylaminopurine, Kinetin riboside, Abscisic acid, Salicylic acid,
beta-Carotene, Ergocalciferol (Vitamin D2), Alpha-tocopherol (vitamin E), Phylloquinone (Vitamin K1),
Thiamine (Vitamin B1), Riboflavin (Vitamin B2), Niacin (Vitamin B3), Niacinamide (vitamin B3), Pantothenic Acid (Vitamin B5), Pyridoxine (Vitamin B6), Folate (Vitamin B9), Cobalamin (Vitamin B12), Ascorbic Acid (Vitamin C),
Fucose, Mannitol, Glucose, Xylose, Mannose, Arabinose, Galactose, Rhamnose, Total Sugars, Glucuronic Acid, Galacturonic Acid, Mannuronic Acid, Guluronic Acid, Iduronic Acid,
Alanine, Arginine, Aspartic Acid, Cystine, Glutamic Acid, Glycine, Histidine, Isoleucine, Leucine, Lysine, Methionine, Phenylalanine, Proline, Serine, Threonine, Tyrosine, Valine,
Aluminium, Calcium, Iron, Magnesium, Phosphorus, Potassium, Silicon, Sodium, Titanium,
Arachidic Acid, Behenic Acid, Decanoic Acid, Erucic Acid, Lauric Acid, Linoleic Acid, Linolenic Acid, Myristic Acid, Caprylic Acid, Oleic Acid, Palmitic Acid, Palmitoleic Acid, Stearic Acid, Lignoceric Acid,
Fucoxanthin, Astaxanthin, Chlorophyll-c, Chlorophyll-a, Chlorophyll-b, Lutein, beta-Carotene, Neoxanthin, Antheraxanthin, Violaxanthin,
Gibberellic Acid, Indole-3-acetic acid, Indole-2-acetic acid, Indole-3-propionic acid, Indole-3-butyric acid, 6-Benzylaminopurine, Kinetin riboside, Abscisic acid, Salicylic acid,
beta-Carotene, Ergocalciferol (Vitamin D2), Alpha-tocopherol (vitamin E), Phylloquinone (Vitamin K1),
Thiamine (Vitamin B1), Riboflavin (Vitamin B2), Niacin (Vitamin B3), Niacinamide (vitamin B3), Pantothenic Acid (Vitamin B5), Pyridoxine (Vitamin B6), Folate (Vitamin B9), Cobalamin (Vitamin B12), Ascorbic Acid (Vitamin C),
Chlorophyll-a, Chlorophyll-b, Lutein, beta-Carotene, Neoxanthin, Astaxanthin, Zeaxanthin, Antheraxanthin, Violaxanthin,
Biomethane Potential (BMP), Total Biogas Volume, Total Solids, Volatile Solids, pH, Biogas Methane Content, Biogas Carbon Dioxide Content, Biogas Oxygen Content, Biogas Hydrogen Sulphide Content, Biogas Ammonia Content,
Total Solids, Volatile Solids, pH, Chemical Oxygen Demand (COD), Biological Oxygen Demand (BOD), Phosphorus, Potassium, Ammonia, Carbon, Hydrogen, Nitrogen, Sulphur,
Residual Biogas Potential (RBP), Total Biogas Volume, Total Solids, Volatile Solids, pH, Biogas Methane Content, Biogas Carbon Dioxide Content, Biogas Oxygen Content, Biogas Hydrogen Sulphide Content, Biogas Ammonia Content,
Acetic Acid, Lactic Acid, Propionic Acid, Butyric Acid, Isobutyric Acid, Valeric Acid, Isovaleric Acid,
Levoglucosan, Cellobiosan, Mannosan, Galactosan, Glucose, Xylose, Mannose, Arabinose, Galactose, Rhamnose, Fucose, Sucrose, Cellobiose, Total Sugars,
31 constituents including Phenol, Furfural, Syringol, and Vanillin
Specific Surface Area (Nitrogen Gas Adsorption), BET Isotherm (5 Point Using Nitrogen),
Specific Surface Area (Nitrogen Gas Adsorption), BET Isotherm (20 Point Using Nitrogen), Pore Volume (Using Nitrogen), Pore Size Distribution (Using Nitrogen), Average Pore Width (Using Nitrogen),
Specific Surface Area (Nitrogen Gas Adsorption), BET Isotherm (40 Point Using Nitrogen), Pore Volume (Using Nitrogen), Pore Size Distribution (Using Nitrogen), Average Pore Width (Using Nitrogen),
Gross Calorific Value, Net Calorific Value, Ash, Carbon, Hydrogen, Nitrogen, Sulphur, Oxygen,
Aluminium, Calcium, Iron, Magnesium, Phosphorus, Potassium, Silicon, Sodium, Titanium,
Antimony, Arsenic, Cadmium, Chromium, Cobalt, Copper, Lead, Manganese, Mercury, Molybdenum, Nickel, Vanadium, Zinc,
Ash Shrinkage Starting Temperature (Reducing), Ash Deformation Temperature (Reducing), Ash Hemisphere Temperature (Reducing), Ash Flow Temperature (Reducing),
Moisture, Ash Content (815C), Carbon, Hydrogen, Nitrogen, Sulphur, Oxygen, Chlorine, Volatile Matter, Fixed Carbon, Aluminium, Calcium, Iron, Magnesium, Phosphorus, Potassium, Silicon, Sodium, Titanium, Gross Calorific Value, Net Calorific Value, Ash Shrinkage Starting Temperature (Reducing), Ash Deformation Temperature (Reducing), Ash Hemisphere Temperature (Reducing), Ash Flow Temperature (Reducing),
As P393 plus inorganic carbon, organic carbon, TGA (under nitrogen and air), and inherent moisture
Aluminium, Calcium, Iron, Magnesium, Phosphorus, Potassium, Silicon, Sodium, Titanium,
Antimony, Arsenic, Cadmium, Chromium, Cobalt, Copper, Lead, Manganese, Mercury, Molybdenum, Nickel, Vanadium, Zinc,
Acenaphthene, Acenaphthylene, Anthracene, Benz[a]anthracene, Benzo[b]fluoranthene, Benzo[k]fluoranthene, Benzo[ghi]perylene, Benzo[a]pyrene, Chrysene, Dibenz[a,h]anthracene, Fluoranthene, Fluorene, Indeno[1,2,3-cd]pyrene, 1-Methylnaphthalene, 2-Methylnaphthalene, Naphthalene, Phenanthrene, Pyrene,
Time to Germination, Mean Shoot Length (Week 1), Mean Shoot Length (Week 2), Mean Shoot Length (Week 3), Mean Shoot Length (Week 4), Shoot Weight (Week 4), Mean Root Length (Week 4), Root Weight (Week 4),
As Deluxe package plus P383, SEM Imaging (P387) and Plant Growth Trials (P388)
Includes everything from P391 (Physical Properties Ultimate), P394 (Thermal Properties Ultimate), and P397 (Soil Amendment Ultimate)
Gross Calorific Value, Net Calorific Value, Ash, Carbon, Hydrogen, Nitrogen, Sulphur, Oxygen,
Aluminium, Calcium, Iron, Magnesium, Phosphorus, Potassium, Silicon, Sodium, Titanium,
Antimony, Arsenic, Cadmium, Chromium, Cobalt, Copper, Lead, Manganese, Mercury, Molybdenum, Nickel, Vanadium, Zinc,
Volatile Matter, Fixed Carbon, Moisture, Ash, Carbon, Hydrogen, Nitrogen, Sulphur, Oxygen, Gross Calorific Value, Net Calorific Value, Chlorine,
Ash Shrinkage Starting Temperature (Oxidising), Ash Deformation Temperature (Oxidising), Ash Hemisphere Temperature (Oxidising), Ash Flow Temperature (Oxidising),
Celignis is a Partner in 3 Successful Proposals for EU Funding
We are pleased to announce that three of the proposals involving Celignis, submitted to the CBE-JU programme for funding collaborative biomass research in Europe, were successful. These projects will provide an additional funding of €1.5m to Celignis and build on our achievements in other CBE and EU projects. In particular, the projects are all at enhanced TRLs (6/7) and will use our existing Celignis Bioprocess infrastructure and will also fund further development of our bioprocessing capacities and the Bioprocess Development Services we offer our clients.
Details on the funded projects are provided below:
BIONEER - This project was funded under CBE-JU topic IA-06 and focuses on the TRL 6/7 production of biobased platform chemicals. Celignis's activities in the project focus on scaling up the work undertaken in our ongoing
Read...
The 2024 North American Biochar Conference will take place in Sacramento, California, on Feb 12-15
On Feb 12-15 we'll be exhibiting at the 2024 North American Biochar Conference, taking place at the SAFE Credit Union Convention Centre in Sacramento, California.
We're looking forward to interacting with the 1000+ expected attendees, outlining our extensive range of analytical and application testing services for biochar.
Celignis CIO Lalitha Gottumukkala will also be a member of the expert panel focused on developing improved laboratory methods for biochar characterisation.
Click here to register for the event.

Read...
This Networking Event Will Involve Discussions on Collaborations for Proposals to the 2024 CBE-JU Topics
The Circular Bioeconomy Europe Joint Undertaking (CBE-JU) is an organisation that funds biomass research in Europe at various Technology Readiness Levels (TRLs). Since 2016 Celignis has been an active participant in a number of projects funded by the CBE-JU.
The Biobased Industries Consortium (BIC) is the steering committee that helps to steer the focus of research for the CBE-JU programme. In 2023 Celignis joined the BIC as a Full Industry Member and participated in several proposals submitted for different research topics in the CBE-JU's 2023 Work Programme.
On Feb 8th Celignis's Dan Hayes, Lalitha Gottumukkala, and Oscar Bedzo will be attending a BIC networking event in Brussels where we will discuss potential collaborations in the research programme topics recently announced for 2024.
Read...
This position will involve working closely with senior management, fostering existing and new client relationships.
Situated in Limerick, Ireland, Celignis currently operates at two centres, Celignis Analytical and Celignis Bioprocess, actively engaging in a variety of private and public bioeconomy projects. As we continue to expand, we're looking to strengthen our team of 14 with a Business Administration and Client Relationship Manager who can bring a blend of enthusiasm and expertise.
This position will involve working closely with senior management, fostering existing and new client relationships, and ensuring successful delivery of our services, playing a key role in our ongoing growth and success.
Click here for more details about the position.
Read...
The event takes place on May 3rd at Carrick-on-Shannon
We are pleased to announce that, on May 3rd, Celignis will be presenting and exhibiting at the National Biochar and Carbon Products Conference 2023, which is taking place in Carrick-on-Shannon in County Leitrm, Ireland.
This conference is being organised under the auspices of the Interreg Northwest Europe-funded THREE C Project, entitled 'Creating and sustaining Charcoal value chains to promote a Circular Carbon economy in NWE Europe'.
The conference will highlight both Irish stakeholders who are currently working in the biochar and carbon products sector, but also partners from the THREE C project (covering Netherlands, Luxembourg, Germany, Belgium, France and Wales, as well as Ireland) who have interesting stories and products to share.
Read...