NIR Model Development at Celignis
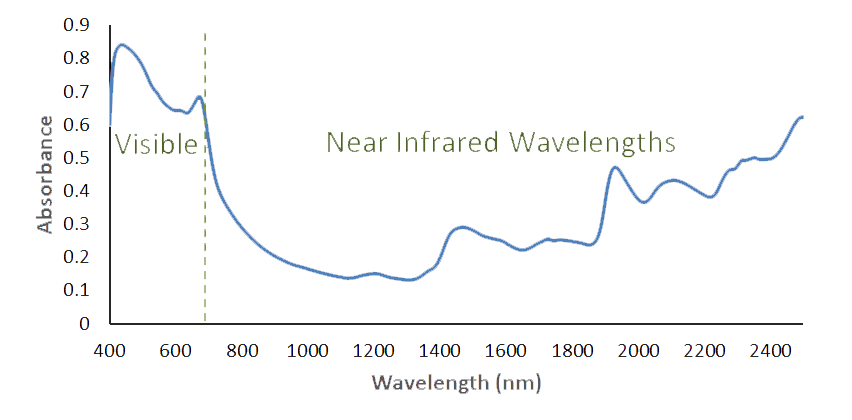
Background to NIR
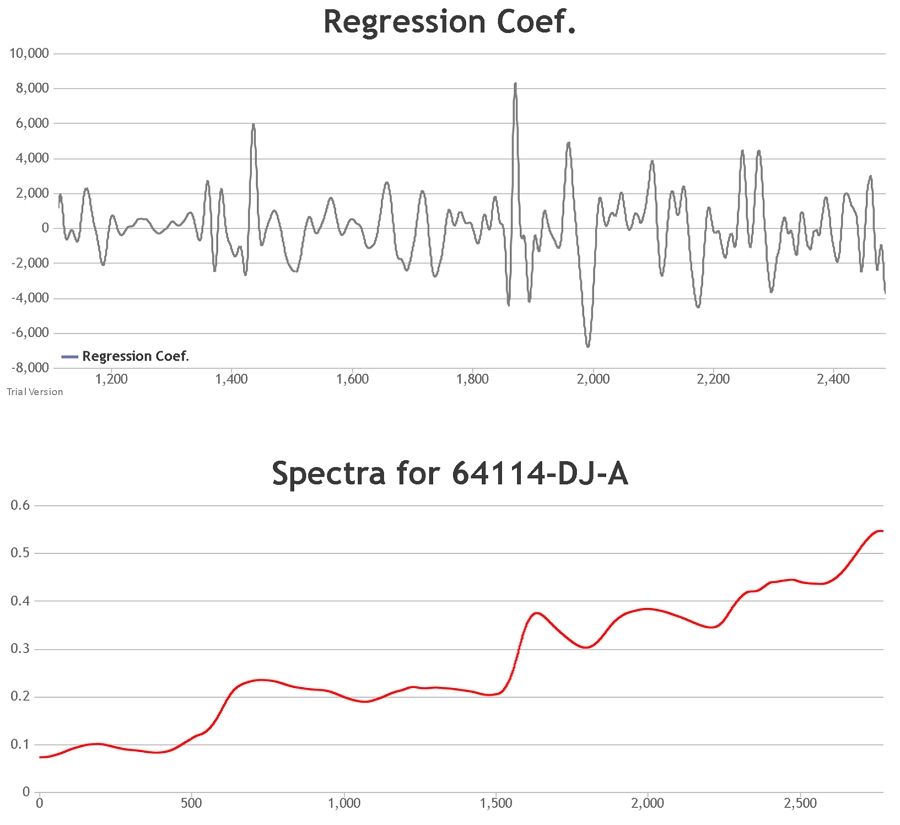
The procedure involves the focussing of radiation on a sample. While some of the radiation will be scattered, some will pass through the sample, interacting with it. When the radiation finally reaches the detector it will pass on this absorbance information. This, along with the scatter from the sample, forms the spectrum of the material.
NIR Model Development
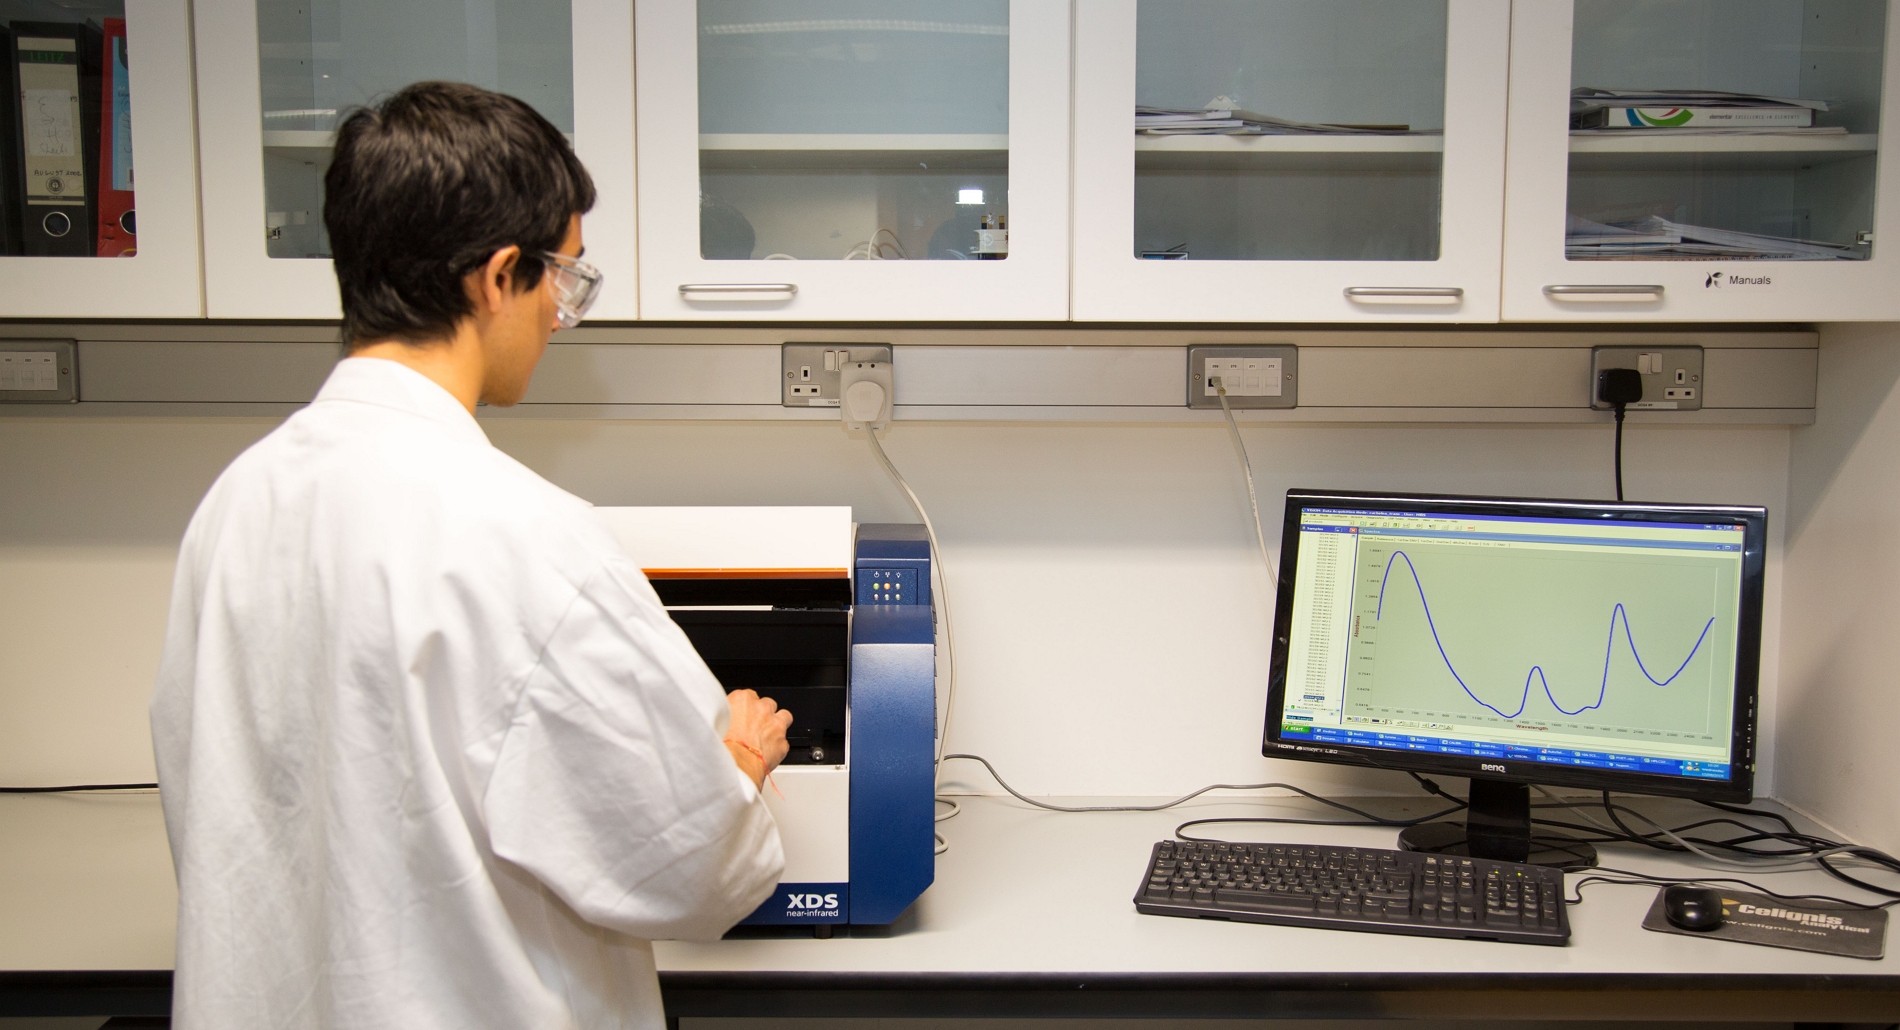
At Celignis spectra are collected using a FOSS XDS Spectrophotometer and the Vision software program. The spectra are then imported into our custom-built chemometric software program for subsequent treatment and model development. This software was developed by Celignis in the BIOrescue BBI project. Partial least squares regression using one Y variable (i.e. PLS1) is used for the development of Celignis models.
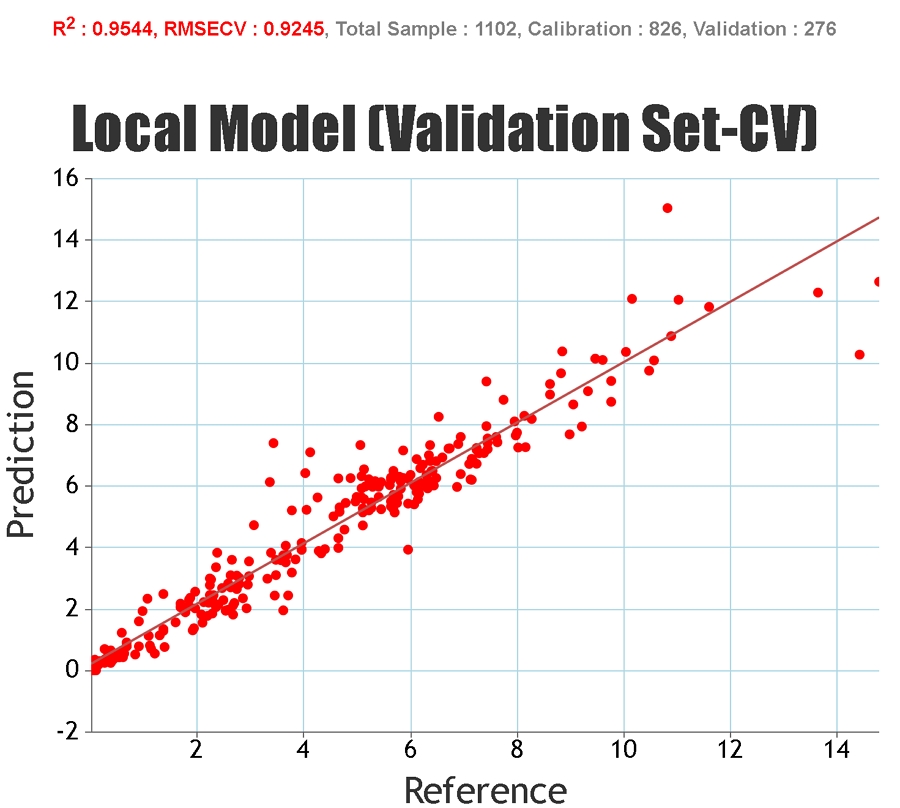
A good model for the prediction of unknown samples should cover a wide variety of sample types and compositional values so that the unknown sample should not be a spectral/chemical/physical "outlier" but instead should be of a similar spectral and physico-chemical composition to some of the samples used to build the model.
Important Statistics
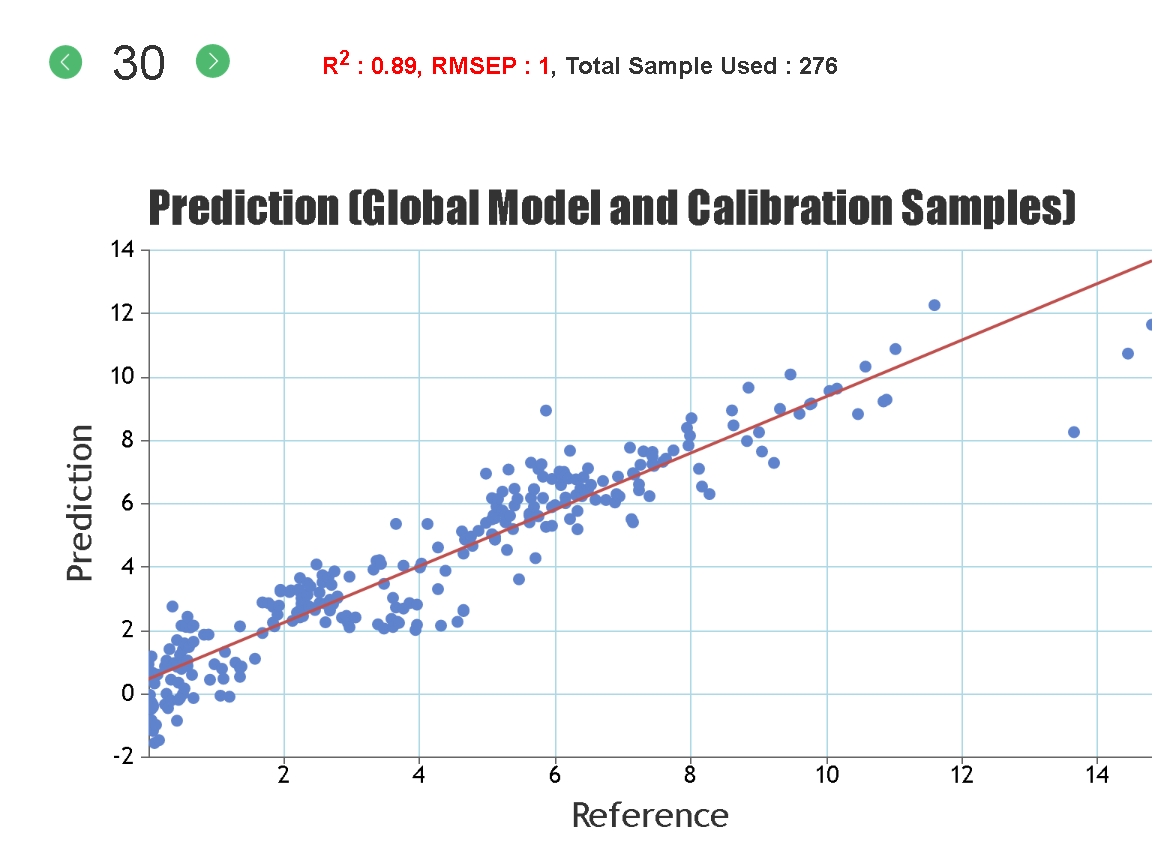
Statistics solely based on the calibration set can give an inaccurate representation of the predictive ability of the model for unknown samples since it is possible to "overfit" the model to the calibration set, particularly if a large number of PLS factors are used. Cross-validation statistics provide a better idea of the robustness of a model but, ideally, independent validation (a test set) should be used. When presenting our regression statistics Celignis will use the values for the test set, unless otherwise stated.
Some of the most important statistics, those that are used on this website, are described below:
RMSEP, Root Mean Square Error of Prediction - This measures the average accuracy (i.e. the difference between the true and estimated compositional value) of the prediction. For the samples in the test set it can be considered that 2 times the RMSEP represents a 95% confidence interval for the real compositional value. For example, if the model predicts a glucan content of 40% and the RMSEP is 1%, then there is a 95% chance that the glucan content of that sample, as measured by wet-chemical means, lies between 38 and 42%.
Bias - This is defined as the average difference between the NIR-predicted value and the real value. A positive value means that, on average, the model is over-estimating the composition by this amount whilst a negative value represents an underestimation.
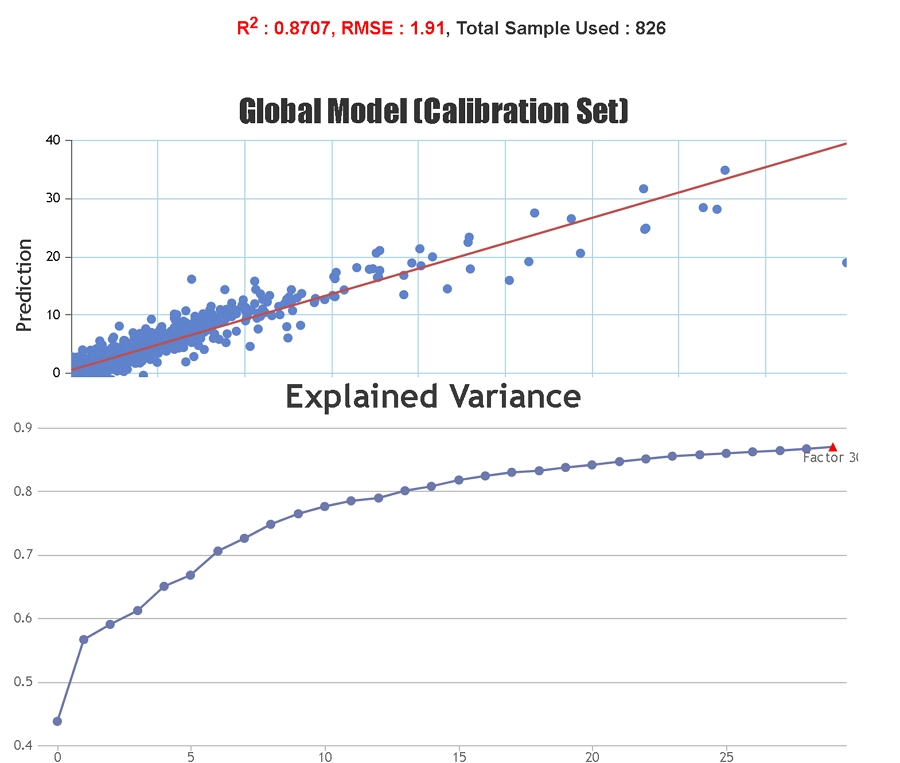
RPD, Ratio of standard error of Performance to standard Deviation - This is equal to the SEP divided by the standard deviation of the compositional values (determined via wet-chemistry) of the samples in the test set. Whilst the RMSEP, SEP, and Bias use the same units of measurement as the constituent (e.g. percent for glucan content), the R-Squared, RPD, and RER (see below) values are dimensionless, meaning that they can be compared on the same basis between models for different constituents/properties. If the RPD is equal to one then the SEP is equal to the standard deviation of the reference data meaning that the model is not predicting the reference values. Higher values for the RPD suggest increasingly accurate models.
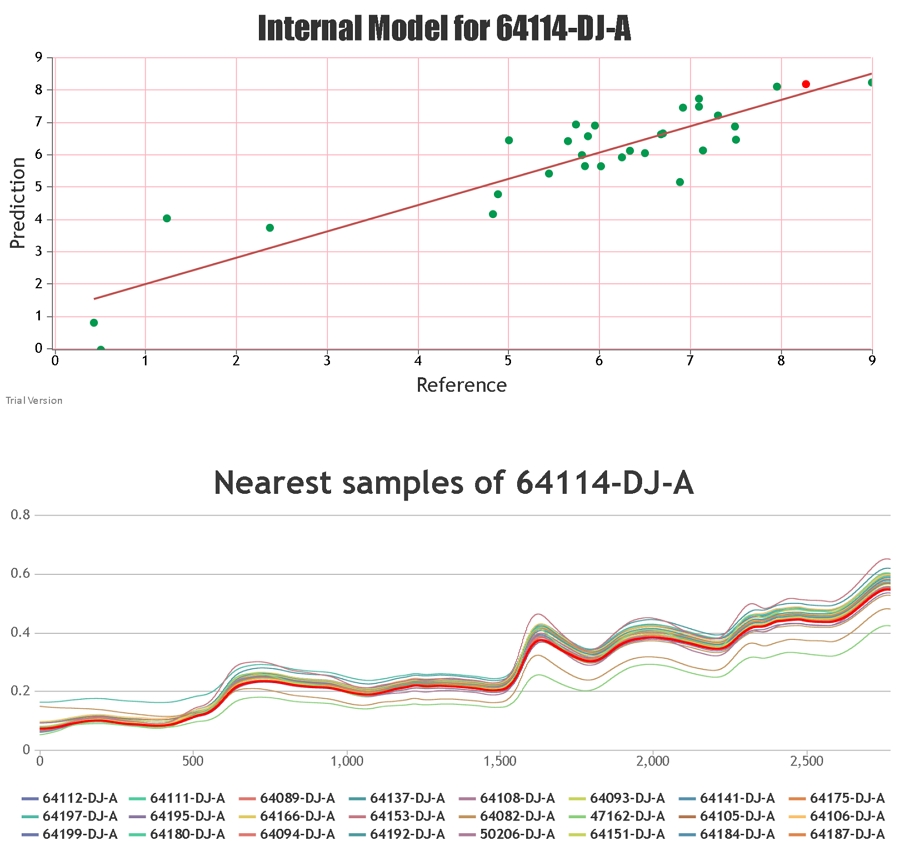
If the type of sample to be predicted is already in the calibration set then the Deviation is likely to be low. Click here for a list of some of the sample types in the current Celignis models.
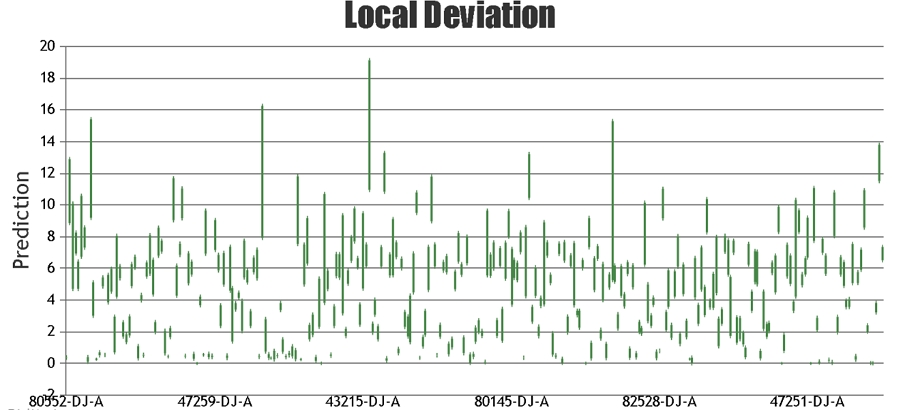
At Celignis, we pride ourselves on the accuracy and precision of our analysis. Customer satisfaction is of paramount importance. For our NIR Analysis Package, if we find that the deviation in prediction is relatively high (defined as a value over 3% for the total lignocellulosic sugars content) then we will undertake the chemical analysis of that sample at no extra charge and provide you with all of the data that we obtain in this analysis. This chemical analysis will cover the analysis packages that we used to develop our NIR models: P3 - Ash Content, P4 - Ethanol Extractives, and P9 - Lignocellulosic Sugars and Lignin.
Click here for more information on the NIR models that have been developed by Celignis and here for some of our peer-reviewed publications on them.
See our pitches for the 2024 topics.
Click here to view our pitches for involvement in proposals for the 2024 research topics of the Circular Bioeconomy Europe Joint Undertaking (CBE-JU).
Lignin (Klason), Lignin (Acid Soluble), Acid Insoluble Residue, Ash (Acid Insoluble),
As P10 plus protein-corrected lignin, water-soluble sugars, uronic acids, acetyl content and starch.
Glucuronic Acid, Galacturonic Acid, Mannuronic Acid, Guluronic Acid, 4-O-Methyl-D-Glucuronic Acid, Iduronic Acid,
Total Sugars in Enzyme Hydrolysate, Glucose in Enzyme Hydrolysate, Xylose in Enzyme Hydrolysate, Arabinose in Enzyme Hydrolysate, Mannose in Enzyme Hydrolysate, Galactose in Enzyme Hydrolysate, Rhamnose in Enzyme Hydrolysate, Cellobiose in Enzyme Hydrolysate, Enzymatic Hydrolysis Kinetics, Cellulose Conversion Yield, Xylan Conversion Yield, Combined Sugar Yield, Cellulose Conversion Rate, Xylan Conversion Rate,
As P121 plus comparisons with data from the non-pretreated original sample, including: Increase in Cellulose Accessibility after Pre-Treatment, Percent Increase in Cellulose Conversion Efficiency, Percent Increase in Cellulose Conversion Rate.
As P9 but on the solid residue after enzymatic hydrolysis.
Formic Acid, Acetic Acid, Levulinic Acid, Furfural, Hydroxymethylfurfural,
Includes all hydrolysate sugars and kinetics in P121 and: Cellulose Conversion Yield, Cellulose Conversion Rate
Includes all hydrolysate sugars and kinetics in P121 and: Xylan Conversion Yield, Xylan Conversion Rate
Total Sugars in Enzyme Hydrolysate, Glucose in Enzyme Hydrolysate, Maltose in Enzyme Hydrolysate, a-Amylase Hydrolysis Kinetics, Glucoamylase Hydrolysis Kinetics,
Glucose, Xylose, Fructose, Sucrose, Mannose, Arabinose, Galactose, Rhamnose, Xylitol, Sorbitol, Trehalose, Mannitol, Arabinitol, Glycerol, Raffinose,
Levulinic Acid, Formic Acid, Hydroxymethylfurfural, Furfural, Acetic Acid, gamma-Valerolactone,
Xylobiose, Xylotriose, Arabinobiose, Arabinotriose,
Maltose, Maltotriose, Maltotetraose, Maltopentaose, Maltohexaose, Maltoheptaose, Maltooctaose,
Glucuronic Acid, Galacturonic Acid, Mannuronic Acid, Guluronic Acid, 4-O-Methyl-D-Glucuronic Acid, Iduronic Acid,
Gibberellic Acid, Indole-3-acetic acid, Indole-2-acetic acid, Indole-3-propionic acid, Indole-3-butyric acid, 6-Benzylaminopurine, Kinetin riboside, Abscisic acid, Salicylic acid,
beta-Carotene, Ergocalciferol (Vitamin D2), Alpha-tocopherol (vitamin E), Phylloquinone (Vitamin K1),
Thiamine (Vitamin B1), Riboflavin (Vitamin B2), Niacin (Vitamin B3), Niacinamide (vitamin B3), Pantothenic Acid (Vitamin B5), Pyridoxine (Vitamin B6), Folate (Vitamin B9), Cobalamin (Vitamin B12), Ascorbic Acid (Vitamin C),
Fucose, Mannitol, Glucose, Xylose, Mannose, Arabinose, Galactose, Rhamnose, Total Sugars, Glucuronic Acid, Galacturonic Acid, Mannuronic Acid, Guluronic Acid, Iduronic Acid,
Alanine, Arginine, Aspartic Acid, Cystine, Glutamic Acid, Glycine, Histidine, Isoleucine, Leucine, Lysine, Methionine, Phenylalanine, Proline, Serine, Threonine, Tyrosine, Valine,
Aluminium, Calcium, Iron, Magnesium, Phosphorus, Potassium, Silicon, Sodium, Titanium,
Arachidic Acid, Behenic Acid, Decanoic Acid, Erucic Acid, Lauric Acid, Linoleic Acid, Linolenic Acid, Myristic Acid, Caprylic Acid, Oleic Acid, Palmitic Acid, Palmitoleic Acid, Stearic Acid, Lignoceric Acid,
Fucoxanthin, Astaxanthin, Chlorophyll-c, Chlorophyll-a, Chlorophyll-b, Lutein, beta-Carotene, Neoxanthin, Antheraxanthin, Violaxanthin,
Gibberellic Acid, Indole-3-acetic acid, Indole-2-acetic acid, Indole-3-propionic acid, Indole-3-butyric acid, 6-Benzylaminopurine, Kinetin riboside, Abscisic acid, Salicylic acid,
beta-Carotene, Ergocalciferol (Vitamin D2), Alpha-tocopherol (vitamin E), Phylloquinone (Vitamin K1),
Thiamine (Vitamin B1), Riboflavin (Vitamin B2), Niacin (Vitamin B3), Niacinamide (vitamin B3), Pantothenic Acid (Vitamin B5), Pyridoxine (Vitamin B6), Folate (Vitamin B9), Cobalamin (Vitamin B12), Ascorbic Acid (Vitamin C),
Chlorophyll-a, Chlorophyll-b, Lutein, beta-Carotene, Neoxanthin, Astaxanthin, Zeaxanthin, Antheraxanthin, Violaxanthin,
Biomethane Potential (BMP), Total Biogas Volume, Total Solids, Volatile Solids, pH, Biogas Methane Content, Biogas Carbon Dioxide Content, Biogas Oxygen Content, Biogas Hydrogen Sulphide Content, Biogas Ammonia Content,
Total Solids, Volatile Solids, pH, Chemical Oxygen Demand (COD), Biological Oxygen Demand (BOD), Phosphorus, Potassium, Ammonia, Carbon, Hydrogen, Nitrogen, Sulphur,
Residual Biogas Potential (RBP), Total Biogas Volume, Total Solids, Volatile Solids, pH, Biogas Methane Content, Biogas Carbon Dioxide Content, Biogas Oxygen Content, Biogas Hydrogen Sulphide Content, Biogas Ammonia Content,
Acetic Acid, Lactic Acid, Propionic Acid, Butyric Acid, Isobutyric Acid, Valeric Acid, Isovaleric Acid,
Levoglucosan, Cellobiosan, Mannosan, Galactosan, Glucose, Xylose, Mannose, Arabinose, Galactose, Rhamnose, Fucose, Sucrose, Cellobiose, Total Sugars,
31 constituents including Phenol, Furfural, Syringol, and Vanillin
Specific Surface Area (Nitrogen Gas Adsorption), BET Isotherm (5 Point Using Nitrogen),
Specific Surface Area (Nitrogen Gas Adsorption), BET Isotherm (20 Point Using Nitrogen), Pore Volume (Using Nitrogen), Pore Size Distribution (Using Nitrogen), Average Pore Width (Using Nitrogen),
Specific Surface Area (Nitrogen Gas Adsorption), BET Isotherm (40 Point Using Nitrogen), Pore Volume (Using Nitrogen), Pore Size Distribution (Using Nitrogen), Average Pore Width (Using Nitrogen),
Gross Calorific Value, Net Calorific Value, Ash, Carbon, Hydrogen, Nitrogen, Sulphur, Oxygen,
Aluminium, Calcium, Iron, Magnesium, Phosphorus, Potassium, Silicon, Sodium, Titanium,
Antimony, Arsenic, Cadmium, Chromium, Cobalt, Copper, Lead, Manganese, Mercury, Molybdenum, Nickel, Vanadium, Zinc,
Ash Shrinkage Starting Temperature (Reducing), Ash Deformation Temperature (Reducing), Ash Hemisphere Temperature (Reducing), Ash Flow Temperature (Reducing),
Moisture, Ash Content (815C), Carbon, Hydrogen, Nitrogen, Sulphur, Oxygen, Chlorine, Volatile Matter, Fixed Carbon, Aluminium, Calcium, Iron, Magnesium, Phosphorus, Potassium, Silicon, Sodium, Titanium, Gross Calorific Value, Net Calorific Value, Ash Shrinkage Starting Temperature (Reducing), Ash Deformation Temperature (Reducing), Ash Hemisphere Temperature (Reducing), Ash Flow Temperature (Reducing),
As P393 plus inorganic carbon, organic carbon, TGA (under nitrogen and air), and inherent moisture
Aluminium, Calcium, Iron, Magnesium, Phosphorus, Potassium, Silicon, Sodium, Titanium,
Antimony, Arsenic, Cadmium, Chromium, Cobalt, Copper, Lead, Manganese, Mercury, Molybdenum, Nickel, Vanadium, Zinc,
Acenaphthene, Acenaphthylene, Anthracene, Benz[a]anthracene, Benzo[b]fluoranthene, Benzo[k]fluoranthene, Benzo[ghi]perylene, Benzo[a]pyrene, Chrysene, Dibenz[a,h]anthracene, Fluoranthene, Fluorene, Indeno[1,2,3-cd]pyrene, 1-Methylnaphthalene, 2-Methylnaphthalene, Naphthalene, Phenanthrene, Pyrene,
Time to Germination, Mean Shoot Length (Week 1), Mean Shoot Length (Week 2), Mean Shoot Length (Week 3), Mean Shoot Length (Week 4), Shoot Weight (Week 4), Mean Root Length (Week 4), Root Weight (Week 4),
As Deluxe package plus P383, SEM Imaging (P387) and Plant Growth Trials (P388)
Includes everything from P391 (Physical Properties Ultimate), P394 (Thermal Properties Ultimate), and P397 (Soil Amendment Ultimate)
Gross Calorific Value, Net Calorific Value, Ash, Carbon, Hydrogen, Nitrogen, Sulphur, Oxygen,
Aluminium, Calcium, Iron, Magnesium, Phosphorus, Potassium, Silicon, Sodium, Titanium,
Antimony, Arsenic, Cadmium, Chromium, Cobalt, Copper, Lead, Manganese, Mercury, Molybdenum, Nickel, Vanadium, Zinc,
Volatile Matter, Fixed Carbon, Moisture, Ash, Carbon, Hydrogen, Nitrogen, Sulphur, Oxygen, Gross Calorific Value, Net Calorific Value, Chlorine,
Ash Shrinkage Starting Temperature (Oxidising), Ash Deformation Temperature (Oxidising), Ash Hemisphere Temperature (Oxidising), Ash Flow Temperature (Oxidising),
Celignis is a Partner in 3 Successful Proposals for EU Funding
We are pleased to announce that three of the proposals involving Celignis, submitted to the CBE-JU programme for funding collaborative biomass research in Europe, were successful. These projects will provide an additional funding of €1.5m to Celignis and build on our achievements in other CBE and EU projects. In particular, the projects are all at enhanced TRLs (6/7) and will use our existing Celignis Bioprocess infrastructure and will also fund further development of our bioprocessing capacities and the Bioprocess Development Services we offer our clients.
Details on the funded projects are provided below:
BIONEER - This project was funded under CBE-JU topic IA-06 and focuses on the TRL 6/7 production of biobased platform chemicals. Celignis's activities in the project focus on scaling up the work undertaken in our ongoing
Read...
The 2024 North American Biochar Conference will take place in Sacramento, California, on Feb 12-15
On Feb 12-15 we'll be exhibiting at the 2024 North American Biochar Conference, taking place at the SAFE Credit Union Convention Centre in Sacramento, California.
We're looking forward to interacting with the 1000+ expected attendees, outlining our extensive range of analytical and application testing services for biochar.
Celignis CIO Lalitha Gottumukkala will also be a member of the expert panel focused on developing improved laboratory methods for biochar characterisation.
Click here to register for the event.

Read...
This Networking Event Will Involve Discussions on Collaborations for Proposals to the 2024 CBE-JU Topics
The Circular Bioeconomy Europe Joint Undertaking (CBE-JU) is an organisation that funds biomass research in Europe at various Technology Readiness Levels (TRLs). Since 2016 Celignis has been an active participant in a number of projects funded by the CBE-JU.
The Biobased Industries Consortium (BIC) is the steering committee that helps to steer the focus of research for the CBE-JU programme. In 2023 Celignis joined the BIC as a Full Industry Member and participated in several proposals submitted for different research topics in the CBE-JU's 2023 Work Programme.
On Feb 8th Celignis's Dan Hayes, Lalitha Gottumukkala, and Oscar Bedzo will be attending a BIC networking event in Brussels where we will discuss potential collaborations in the research programme topics recently announced for 2024.
Read...
This position will involve working closely with senior management, fostering existing and new client relationships.
Situated in Limerick, Ireland, Celignis currently operates at two centres, Celignis Analytical and Celignis Bioprocess, actively engaging in a variety of private and public bioeconomy projects. As we continue to expand, we're looking to strengthen our team of 14 with a Business Administration and Client Relationship Manager who can bring a blend of enthusiasm and expertise.
This position will involve working closely with senior management, fostering existing and new client relationships, and ensuring successful delivery of our services, playing a key role in our ongoing growth and success.
Click here for more details about the position.
Read...
The event takes place on May 3rd at Carrick-on-Shannon
We are pleased to announce that, on May 3rd, Celignis will be presenting and exhibiting at the National Biochar and Carbon Products Conference 2023, which is taking place in Carrick-on-Shannon in County Leitrm, Ireland.
This conference is being organised under the auspices of the Interreg Northwest Europe-funded THREE C Project, entitled 'Creating and sustaining Charcoal value chains to promote a Circular Carbon economy in NWE Europe'.
The conference will highlight both Irish stakeholders who are currently working in the biochar and carbon products sector, but also partners from the THREE C project (covering Netherlands, Luxembourg, Germany, Belgium, France and Wales, as well as Ireland) who have interesting stories and products to share.
Read...