• Thermogravimetric Analysis
    TGA

Background to Thermogravimetric Analysis

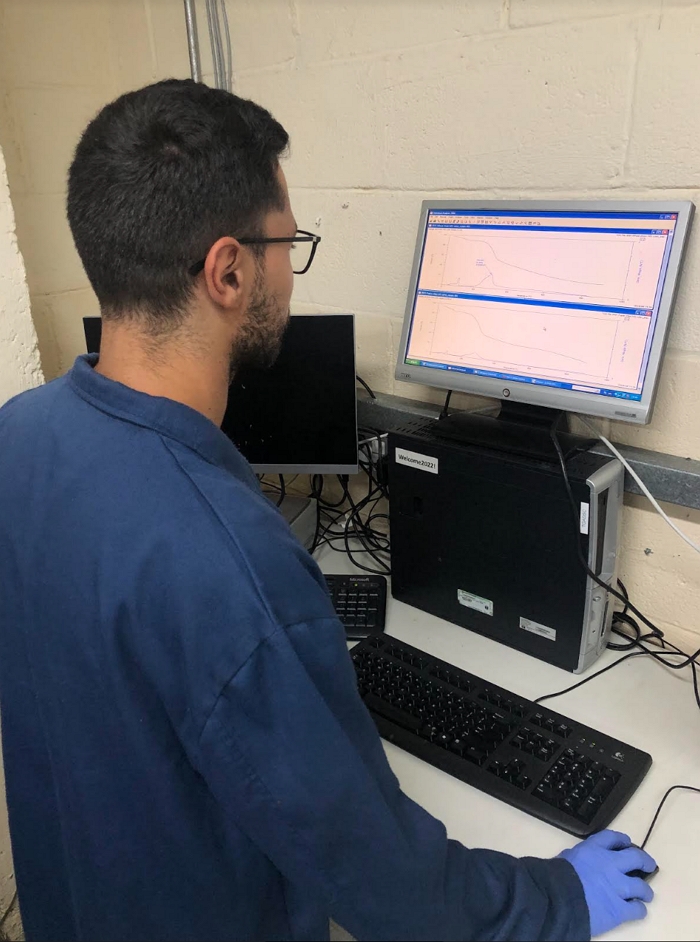
Thermogravimetric analysis (TGA) is a useful means of evaluating the thermal behaviour of a material over a wide temperature range. This method of analysis is widely used to evaluate the stability, purity, and thermal tolerance of a range of materials such as polymers, fuels, and fibres. As a result, TGA is particularly useful for examining new biobased materials and products and in comparing them against the alternatives (biobased and non-biobased) that currently exist in the marketplace.

Thermogravimetric analysis involves the weight of a sample being recorded as the temperature it is exposed to increases. We can undertake this analysis in a range of different atmospheres, with nitrogen and air being the most commonly used. At Celignis we would normally recommend using nitrogen as the enivronmental gas as this allows you to evalaute the volatility of the sample at different temperatures without the interference of combustion on the results.


Interpretation of TGA Data

Thermogravimetric analysis produces a curve, that shows the effect of temperature (or time), presented on the x axis, on the weight of the sample (the y axis). The weight is usually expressed in terms of the percentage of the sample that remains, versus the weight at the start of the experiment, at a given temperature/time.

Our reports also include a second y axis on the graph which presents the data for the first derivative of the TGA curve. This is known as the Derivative Thermogravimetric (DTG) curve and represents the rate of change of mass with respect to temperature (e.g. % mass loss per degree Celcius) or time (e.g. % mass loss per second). The DTG curve often allows for easier visual interpretation of the data, as periods of large mass change can be seen with more clarity.

The losses in mass at given ranges of temperature ranges can be said to provide indications with regards to the relative abundance of various chemical components in the sample. For example, hemicelluloses degrade between 250 and 300 °C, whilst cellulose is known to rapidly become volatile under a relatively small temperature range of 300-325 °C under an air environment. These temperature ranges tend to shift upwards when nitrogen is instead used as the environmental gas whislt the resolution of the analysis often improves when this gas is used.

A rapid drop in weight is usually indicative of an abundance of a particular component, whilst a slow descline in weight can suggest the presence of multiple volatile components in the region.

Thermogravimetric Analysis at Celignis

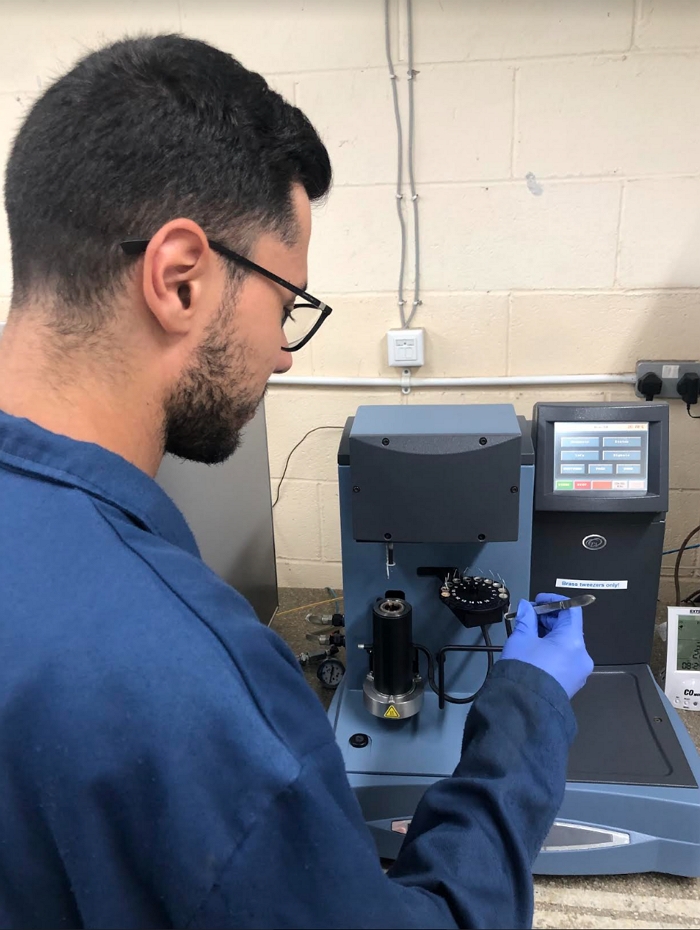
We can undertake TGA analysis using just small amounts of sample (e.g 10 mg) whilst still providing accurate mass data for the experiment. We use a TA Instruments Q500 TGA system which, due to its precise control of temperature and gases, along with its highly sensitive weighing scales, is considered to be on the leading edge for scientific research.

We can employ various different programs for the TGA analysis, according to your particular preference, or we can recommend a suitable program based on our experience with the thermogravimetric analysis of a wide range of materials. Such properties that can be changed include:

- The temperature range over which the experiment is conducted.
- The rate of change of the temperature (for example an increase of 5 degrees Celcius per minute).
- Whether there are periods during which the temperature is held constant for a set period of time.
- Combinations of the above temperature treatments, for example periods during the program where the temperature is maintained coupled with phase(s) where one or more temperature gradients are applied.
- Different environmental gases used at different stages of the program. For example, we can run under a nitrogen atmosphere until the final stage of the program where air is then introduced, allowing the sample to be incinerated with only the ash remaining.
- Whether the data are reported as a function of time or temperature. We normally report results with temperature on the x axis but can change this according to your preference. We can also present the DTG curve in various forms.

Celignis News Articles on TGA Analysis

August 17th 2022

New Article on Biochar Analysis


Read about the wide variety of analysis packages we have for biochar

Click here to read about the different analysis packages that Celignis offers for the evaluation on biochars. These analyses cover properties relevant to a wide variety of applications, including soil amendment, carbon sequestration, bioenergy, and biomaterials.

August 1st 2022

Special Offer on TGA Analysis


For a short period we are offering two TGA analyses for the price of one!

To celebrate the arrival of our thermogravimetric (TGA) equipment, we are offering, for a limited time period, two TGA analyses for the price of one. Click here to read more about TGA analyses at Celignis and to see the various packages on offer.

To avail of this special offer please mention the code (TGA-AUGUST) in an email or when placing an order via the Celignis Database.


...